User Interface (UI): การออกแบบ front end

Sources: @wickham2021mastering [Ch. 2]

พื้นฐาน

  • พยามยามแยกส่วน Shiny code ที่สร้าง UI (front end) กับส่วนการทำงานหลังบ้าน (server/back end).
  • ตอนนี้เราโฟกัสไปที่ตัวหน้าตาหรือ front end และก็ดูพวก inputs และ outputs
    • อย่าเพิ่งรวมตัวหรือต่อ inputs กับ outputs เข้าด้วยกัน
  • ให้โฟกัสกับตัวองค์ประกอบหรือ components พื้นฐาน (ที่มากับตัว Shiny package) ส่วน components อิ่นๆ สามารถดูได้ที่ awesome shiny extenstions

UI: Layout

  • Shiny app โดยทั่วไปจะประกอบด้วย ui, server และ shinyApp(ui=ui, server = server)
    • ui <- function(): เป็น function ที่ใช้สำหรับสร้าง UI
      • UI แสดง inputs และ outputs ต่างๆ
    • Shiny provides different functions that can be used to create basic layouts
  • fluidPage() ใช้สำหรับสร้าง classic fluid layout
  • dashboardPage() สำหรับสร้าง dashboard layout (ซึ่ง Guerry dashboard ก็ใช้ function นึ้)

fluidPage

  • fluidPage(): เป็น layout พื้นฐาน
    • สามารถที่จะแสดงผลโดยปรับเปลี่ยนขนาดอัตโนมัติตามขนาดของ web browser (อย่างเช่น smartphone)
    • layout ประกอบด้วยแถวที่แบ่งเป็น columns
      • rows เป็นตัวที่ทำให้ตัวองค์ประกอบต่างๆมันแสดงผลในบรรทัดเดียวกัน
      • columns เป็นตัวกำหนดว่าในแนวขวางเจ้าองค์ประกอบนั้นๆมันจะกว้างเท่าไหร่ (ภายในตารางกว้าง 12 หน่วย)
  • ด้านล่างเป็น UI กับ title panel และ sidebar panel
    • titlePanel() และ sidebarLayout() สำหรับสร้าง Shiny app/layout พื้นฐานที่มี sidebar
    • sidebarLayout() จะมี 2 functions
      • sidebarPanel(): เพื่อแสดงเนื้อหาใน sidebar
      • mainPanel(): เพื่อแสดงเนื้อหา main panel
    • fluidRow() และ column(): เพือแบ่ง ui เป็น rows/columns
  • ทดลอง code ด้านล่างนี้
Code: Creating a simple UI
ui <- fluidPage(
  titlePanel("This is the title panel"),
  
  sidebarLayout(
    sidebarPanel( "Title: Sidebar panel"),
    
    mainPanel("Title: Main panel",
              fluidRow(
                column(width = 4,"Column 1: Description here"),
                column(width = 4, "Column 2: Model summary")
                ,
                column(width = 3, 
                       offset = 1, 
                       "Column 3: Model visualization")
              )
  )))

server <- function(input, output){}

shinyApp(ui=ui, server = server)
  • เปลี่ยน sidebarLayout(position = "right",...) เพื่อขยับ sidebar อยู่ด้านขวา
  • navbarPage(): สำหรับสร้าง UI multi-page user-interface ที่มี navigation bar
  • บางคริั้งใส่ขอบก็ช่วย..
Code: Adding borders for better understanding of UI
ui <- fluidPage(
  titlePanel("This is the title panel"),
  
  sidebarLayout(
    sidebarPanel( "Title: Sidebar panel"),
    
    mainPanel("Title: Main panel",
              fluidRow(
                column(style='border: 1px solid black',
                       width = 4,"
                       Column 1: Description here"),
                column(style='border: 1px solid black',
                       width = 4, "Column 2: Model summary")
                ,
                column(style='border: 1px solid black',
                       width = 3, 
                       offset = 1, 
                       "Column 3: Model visualization")
              )
    )))

server <- function(input, output){}

shinyApp(ui=ui, server = server)

การสร้าง panels และ tabs

  • tabsetPanel() + tabPanel()
    • สำหรับ sidebar layout แต่แบ่ง main panel เป็น tabs
    • ผู้ใช้สามารถที่จะสลับไปมาระหว่าง tabs ได้
ui <- fluidPage(
  titlePanel("This is the title panel"),
  
  sidebarLayout(
    sidebarPanel( "This is the sidebar panel"),
    
    mainPanel(
      tabsetPanel(type = "tabs",
                  tabPanel("3d Frequency Plot", 
                           "Tab 1: plot here"),
                  tabPanel("Histogram", 
                           "Tab 2: another plot here"),
                  tabPanel("Model Summary", 
                           h4("Tab 3: estimation results here")),
                  tabPanel("Data Summary", 
                           h4("Tab 4: Variable summaries"))
      ))))
  
  server <- function(input, output){}
  
  shinyApp(ui=ui, server = server)

dashboardPage

  • dashboardPage(): สำหรับสร้าง dashboard interface
    • function นี้จะมีอยู่ใน packages shinydashboard และ bs4Dash (ใช้ bs4Dash1!)
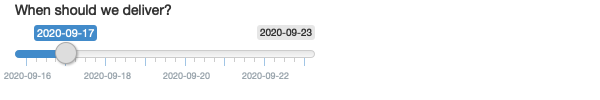
    • dashboardHeader(): สร้างส่วนหัว (header) ของ dashboard
    • dashboardSidebar(): สร้าง dashboard sidebar
      • sidebar โดยปกติจะประกอบด้วย sidebarMenu, หรืออาจเป็น sidebarSearchForm, หรือ Shiny inputs อื่นๆ
    • dashboardBody(): สำหรับสร้าง main body ที่อาจประกอบด้วย boxes หรือ tabItems
library(bs4Dash)
# UI ----
ui <- dashboardPage(title = "The Guerry Dashboard",

  ### Header ----
  header = dashboardHeader(),

  ### Sidebar ----
  sidebar = dashboardSidebar(),

  ### Body ----
  body = dashboardBody()
)

# Server ----
server <- function(input, output, session) {}

shinyApp(ui, server)

ใส่พวก items และ tabs

  • ?sidebarMenu(): สร้าง sidebarMenu ภายใน dashboardSidebar
    • menuItem(tabName = "...", text = "...", icon = icon("table")): ใส่หนึ่ง item ใน sidebarMenu
  • tabItems(): สร้างตัว container สำหรับ tab items
    • tabItem(tabName = "insp", ...): สร้าง tab ใส่ใน tab items container
    • สามารถใช้ร่วมกับ fluidRow() และ column()
    • เชื่อมต่อกับผ่านชื่อ tabName
library(bs4Dash)
# UI ----
ui <- dashboardPage(title = "The Guerry Dashboard",

  ### Header ----
  header = dashboardHeader(
    title = "Title here"
  ),

  ### Sidebar ----
  sidebar = dashboardSidebar(
    sidebarMenu(
      menuItem(tabName = "tab_table", 
               text = "Table data", 
               icon = icon("table"))
    )
  ),
  ### Body ----
  body = dashboardBody(
    tabItems( # start tabItems

      tabItem(
        tabName = "tab_table",
        hr(), # add separation line
        "Here we will put a table"
      )
      
    ) # end tabItems
  )
) # End UI


# Server ----
server <- function(input, output, session) {}

shinyApp(ui, server)

รูปภาพ

  • img() function สำหรับใส่ image
    • img(src = "http://.../img-2.jpg", height = 35, width = 35): Load image จาก website หรือ folder
  • เก็บ image(s) ไว้ที่เครื่อง
    • www subfolder สำหรับเก็บข้อมูล(images, data etc.) ไว้ใช้กับapp
    • ถ้า working directory = app directory กก็สามารถสร้างได้ด้วยคำสั่ง: dir.create("www")
    • ภาพที่เก็บไว้ที่ www สามรถเรียกใช้ได้เลยโดยไม่ต้องพิมพ์ชื่อwwwนำหน้าชื่อไฟล์
      • e.g., img(src = "guerry.jpg", width = "100%")
Code: Adding images
1ui <- dashboardPage(
  title = "The Guerry Dashboard",
  
  ### Header ----
2  header = dashboardHeader(
3    span(style = "display: inline-block; width: 100%;"),
4    a(
      class = "logo",
      href = "https://ammnet.org/",
      img(src = "ammnet.png", style = "height: 1.8em;")
    ),
5    title = tagList(
      img(src = "ammnet.png", width = 35, height = 35),
      span("The Guerry Dashboard", class = "brand-text")
    )
  ),
  
  ### Sidebar ----
6  sidebar = dashboardSidebar(
    sidebarMenu(
7      menuItem(tabName = "tab_image",
               text = "Image section", 
               icon = icon("image"))
    )
  ),
  ### Body ----
8  body = dashboardBody(
9    tabItems(
10      tabItem("tab_image",
              img(src = "https://journals.openedition.org/belgeo/docannexe/image/11893/img-1.jpg", width = 358, height = 476)
      )
    ) # end tabItems
  )
) # End UI

# Server ----

11server <- function(input, output, session) {}

12shinyApp(ui, server)
1
dashboardPage(): function หลักสำหรับสร้าง dashboard page layout ใน Shiny.
2
dashboardHeader(): Function สำหรับ header ของ dashboard.
3
span(): Function เพื่อทำ HTML span กับตัว element โดยใช้ style attribute ที่ควบคุมการแสดงผลของตัว element นั้นๆ
4
a(): Function สำหรับทำ hyperlink element (“a” HTML tag) กับ specified class, href attribute (URL), และ nested img (image) element
5
tagList(): Function สำหรับทำ HTML list ในที่นี้มันถูกใช้เพื่อรวม title เข้าด้วยกัน
6
dashboardSidebar(): Function สำหรับสร้าง sidebar ของ dashboard.
7
menuItem(): Function เพื่อเพิ่ม item เข้าไปใน sidebar menu
8
dashboardBody(): Function เพื่อสร้างตัว body ของ dashboard.
9
tabItems(): Function สร้างส่วน tabbed content ตัว arguments คือคู่ของ tab names กับตัวเนื้อหา
10
tabItem(): Function สำหรับสร้าง tab item ตัว arguments คือคู่ของ tab names กับตัวเนื้อหา
11
server: สำหรับใส่การทำงานส่วนของ server ในกรณีนี้ว่างไว้ก่อน
12
shinyApp(ui, server): function หลักสำหรับสร้าง Shiny app ซึ่งมันต้องการส่วน UI กับส่วน server ตามที่ได้เขียนcodeไว้

ใส่ images

  • ตัวอย่างสำหรับใส่ภาพ
Code: Adding images
ui <- dashboardPage(
  title = "The Guerry Dashboard",
  
  ### Header ----
  header = dashboardHeader(
    span(style = "display: inline-block; width: 100%;"),
    a(
      class = "logo",
      href = "https://ammnet.org/",
      img(src = "ammnet.png", style = "height: 1.8em;")
    ),
    title = tagList(
      img(src = "ammnet.png", width = 35, height = 35),
      span("The Guerry Dashboard", class = "brand-text")
    )
  ),
  
  ### Sidebar ----
  sidebar = dashboardSidebar(
    sidebarMenu(
      menuItem(tabName = "tab_image",
               text = "Image section", 
               icon = icon("image"))
    )
  ),
  ### Body ----
  body = dashboardBody(
    tabItems( 
      tabItem("tab_image",
              img(src = "https://journals.openedition.org/belgeo/docannexe/image/11893/img-1.jpg", width = 358, height = 476),
                            img(src = "https://journals.openedition.org/belgeo/docannexe/image/11893/img-1.jpg", width = 358, height = 476)
      )
    ) # end tabItems
  )
) # End UI

# Server ----

server <- function(input, output, session) {}

shinyApp(ui, server)

Exercise: UI layout

  1. พยายามทำความเข้าใจ code Section 2.3.
  2. เปลี่ยน website title เป็น “A big name in politics” หรืออะไรก็ได้ตามต้องการ
  3. เปลี่ยน sidebar menu title เป็น “The Arni dashboard” หรืออะไรก็ได้ตามต้องการ
  4. เปลี่ยนภาพของ Guerry เป็นภาพอื่น เช่นภาพของ Arnold Schwarzenegger จาก web เช่น here.
  • หรือจะทดลองเรียกภาพที่เก็บไว้ใน www มาใช้ดู
# UI ----
ui <- dashboardPage(
  title = "A big name in politics",
  
  ### Header ----
  header = dashboardHeader(
    span(style = "display: inline-block; width: 100%;"),
    a(
      class = "logo",
      href = "https://ammnet.org/",
      img(src = "ammnet.png", style = "height: 1.8em;")
    ),
    title = tagList(
      img(src = "ammnet.png", width = 35, height = 35),
      span("The Arni Dashboard", class = "brand-text")
    )
  ),
  
  ### Sidebar ----
  sidebar = dashboardSidebar(
    sidebarMenu(
      menuItem(tabName = "tab_image", 
               text = "Image section", 
               icon = icon("image"))
    )
  ),
  ### Body ----
  body = dashboardBody(
    tabItems( # start tabItems
      tabItem("tab_image",
              img(src = "http://assets.schwarzenegger.com/images/img-2.jpg", 
                  width = 729, height = 423)
      )
    ) # end tabItems
  )
) # End UI

# Server ----

server <- function(input, output, session) {}

shinyApp(ui, server)
  1. ตรวจดูว่าเราอยู่ในdirectoryอะไร getwd().
  2. เช็คดูอีกครั้งว่าไฟล์ app.R อยู่ใน directory เดียวกันนี้
  3. ใช้คำสั่ง dir.create("www") หรือปุ่มใน RStudio เพื่อสร้าง www folder
  4. เก็บภาพจาก link ไว้ใน www folder นี้
  5. หลังจากนั้นก็เพิ่มภาพโดยใช้คำสั่ง img(src = "img-2.jpg", width = 729, height = 423)
  • ภาพที่เก็บใน www สามารถเรียกใช้ได้เลยโดยไม่ต้องพิมพ์path
  1. รัน app
# UI ----
ui <- dashboardPage(
  title = "A big name in politics",
  
  ### Header ----
  header = dashboardHeader(
    span(style = "display: inline-block; width: 100%;"),
    a(
      class = "logo",
      href = "https://ammnet.org/",
      img(src = "ammnet.png", style = "height: 1.8em;")
    ),
    title = tagList(
      img(src = "workshop-logo.png", width = 35, height = 35),
      span("The Arni Dashboard", class = "brand-text")
    )
  ),
  
  ### Sidebar ----
  sidebar = dashboardSidebar(
    sidebarMenu(
      menuItem(tabName = "tab_image", 
               text = "Image section", 
               icon = icon("image"))
    )
  ),
  ### Body ----
  body = dashboardBody(
    tabItems( # start tabItems
      tabItem("tab_image",
              img(src = "img-2.jpg", 
                  width = 729, height = 423)
      )
    ) # end tabItems
  )
) # End UI

# Server ----

server <- function(input, output, session) {}

shinyApp(ui, server)

UI: Inputs

UI Inputs: โครงสร้างทั่วไป

  • inputId argument:
    • inputId ทำหน้าที่เป็นตัวเชื่อม front end กับ back end โดยที่ถ้า UI มี input ที่มีชื่อ ID name ฝั่งของ server function สามารถเข้าถึงค่าผ่าน input$name
    • name` = ตัวอักษรง่ายๆ (ตัวหนังสือ, เลข และ underscores) และ จำเพาะ ไม่ซ้ำ
    • Inputs จะถูกเก็บใน list ซึ่งเรียกผ่าน input$...
  • label argument: สำหรับ label ที่อ่านเข้าใจง่าย
  • value argument: ค่า default value
  • ส่วนที่เหลือ อีก 4 ตัว ก็เป็นค่าเฉพาะอื่นๆสำหรับตัวแปรนั้นๆ
  • แนะนำ: ให้ใช้ตำแหน่งกับ inputId และ label และส่วนอื่นๆใช้ชื่อ
    • Q: เราอ่านคำสั่งนี้ว่าอย่างไร
      • sliderInput("min", "Limit (minimum)", value = 50, min = 0, max = 100)

UI Inputs: Logic

  • Widget = Web element ที่ผู้ใช้สามารถมีปฏิสัมพันธ์ด้วยได้ (Shiny widget gallery)
    • ผู้ใช้สามารถส่งข้อความไปยัง serverได้ (เช่น “ผมต้องการเลือกตัวแปรนี้”)
  • เบื้องหลังมันจะเหมือนกันหมดสำหรับ logic ของ widgets
    • ผู้ใช้ใช้ widget เพื่อให้ค่า inputs
    • Input ก็จะถูกแทรกเข้าไปใน functions ในส่วน SERVER
      • server <- function(input, output) {}
  • ใน shiny จะมีหลาย widgets
    • จะมีเพิ่มเติมอีกใน shinyWidgets package (เช่น pickerInput())

UI Inputs: ตัวอย่าง

  • ลองรัน code ด้านล่างนี้ใน R
library(shinyWidgets) # Install!

animals <- c("dog", "cat", "mouse") # Predefining some categories

ui <- fluidPage(
  
  # Free text
  textInput("name", "What's your name?"),
  passwordInput("password", "What's your password?"),
  textAreaInput("story", "Tell me about yourself", rows = 3),
  
  # Numeric inputs
  numericInput("num", "Number one", value = 0, min = 0, max = 100),
  sliderInput("num2", "Number two", value = 50, min = 0, max = 100),
  sliderInput("rng", "Range", value = c(10, 20), min = 0, max = 100),
  
  # Dates
  dateInput("dob", "When were you born?"),
  dateRangeInput("holiday", "When do you want to go on vacation next?"),
  
  # Limited choices
  selectInput("state", "What's your favourite animal?", animals),
  radioButtons("animal", "What's your favourite animal?", animals),
  selectInput( "state", "What's your favourite animal?", animals, multiple = TRUE),
  checkboxGroupInput("animal2", "What animals do you like?", animals),
  pickerInput(
    inputId = "animal3",
    label = "What animals do you like?",
    choices = animals
  ),
  
  # Single checkbox
  checkboxInput("cleanup", "Clean up?", value = TRUE),
  checkboxInput("shutdown", "Shutdown?"),
  
  # File uploads
  fileInput("upload", NULL),
  
  # Action buttons
  actionButton("click", "Click me!"),
  actionButton("drink", "Drink me!", icon = icon("cocktail"))
)

server <- function(input, output, session) {}

shinyApp(ui, server)

Exercise(s)

  1. เราจะใส่ข้อความหรือที่เรียกว่า placeholder ให้ปรากฏ ภายใน ช่องใส่ข้อความได้อย่างไร ด้วยคำสั่ง textInput() Figure 1 ตามด้านล่างนี้ (ดู ?textInput)?

Figure 1: Text input (Source: Wickham 2021)
textInput("text", "", placeholder = "Your name")
  1. อ่านเอกสารของคำสั่ง sliderInput() เพื่อดูว่าเราจะสร้าง date slider อย่างตัวอย่างนี้ได้อย่างไร Figure 2.

Figure 2: Date slider (Source: Wickham 2021)
sliderInput(
  "dates",
  "When should we deliver?",
  min = as.Date("2019-08-09"),
  max = as.Date("2019-08-16"),
  value = as.Date("2019-08-10")
)
  1. สร้าง slider สำหรับเลือกค่าระหว่าง 0 ถึง 100 โดยมี stepของค่าที่เลือกได้คือ 5 พร้อมกับเพิ่มปุ่ม play เพื่อให้ผู้ใช้สามารถเปลี่ยนค่าได้เองอัตโนมัติ
  sliderInput("number", "Select a number:",
              min = 0, max = 100, value = 0, 
              step = 5, animate = TRUE)
  1. ถ้าเรามีลิสต์ที่จะใช้กับ selectInput() ที่ค่อนข้างยาว เราควรที่จะแบ่งเป็นกลุ่มย่อย ๆ ลองอ่านเอกสารของ selectInput() นี่ดูว่าเราจะทำแบบนั้นได้อย่างไร (Hint: ลองดูในส่วน HTML ที่เรียกว่า <optgroup>.)
selectInput(
  "breed",
  "Select your favorite animal breed:",
  choices =
    list(`dogs` = list('German Shepherd', 'Bulldog', 
                       'Labrador Retriever'),
         `cats` = list('Persian cat', 'Bengal cat', 
                       'Siamese Cat'))
)
ui <- fluidPage(
  textInput("text", "", placeholder = "Your name"),
  
  sliderInput(
  "dates",
  "When should we deliver?",
  min = as.Date("2019-08-09"),
  max = as.Date("2019-08-16"),
  value = as.Date("2019-08-10")
  ),
 
    sliderInput("number", "Select a number:",
              min = 0, max = 100, value = 0, 
              step = 5, animate = TRUE),
  
  selectInput(
  "breed",
  "Select your favorite animal breed:",
  choices =
    list(`dogs` = list('German Shepherd', 'Bulldog', 
                       'Labrador Retriever'),
         `cats` = list('Persian cat', 'Bengal cat', 
                       'Siamese Cat'))
)
  
)
server <- function(input, output, session) {
  
  
}
shinyApp(ui, server)
  • ลอกและเรียบเรียงมาจาก stackoverflow.
#rm(list=ls())
library(shiny)

ui <- basicPage(
  textInput("text", "", placeholder = "Your name"),
  
  sliderInput(
    "dates",
    "When should we deliver?",
    min = as.Date("2019-08-09"),
    max = as.Date("2019-08-16"),
    value = as.Date("2019-08-10")
  ),
  
  sliderInput("number", "Select a number:",
              min = 0, max = 100, value = 0, 
              step = 5, animate = TRUE),
  
  selectInput(
    "breed",
    "Select your favorite animal breed:",
    choices =
      list(`dogs` = list('German Shepherd', 'Bulldog', 
                         'Labrador Retriever'),
           `cats` = list('Persian cat', 'Bengal cat', 
                         'Siamese Cat'))),
  tableOutput('show_inputs')
)
server <- shinyServer(function(input, output, session){
  
  AllInputs <- reactive({
    myvalues <- NULL
    for(i in 1:length(names(input))){
      myvalues <- as.data.frame(rbind(myvalues,(cbind(names(input)[i],input[[names(input)[i]]]))))
    }
    names(myvalues) <- c("User Input","Last Value")
    myvalues
  })
  
  output$show_inputs <- renderTable({
    AllInputs()
  })
})
shinyApp(ui = ui, server = server)

UI: Outputs

  • Outputs ใน UI คอส่วนที่สร้างพื้นที่ที่จะแสดงผลจาก server function
  • ซึ่งมันจะมีชื่อ ID เฉพาะของใครของมันเหมือน inputs
    • เช่น textOutput("text") ชื่อ ID คือtext ที่จะถูกเติมค่าจาก server
  • ถ้า UI ที่สร้างใช้ชื่อ output ID คือtext เราสามารถที่จะเข้าถึงค่าของมันภายใน server function ได้ด้วยการเรียกผ่าน output$text (ดูด้านล่าง)
  • แต่ล่ะ output function ในหน้าfront end มันจะผูกติดกับ render function ที่ back end (server)
  • output มี 3 ประเภทหลัก: text ข้อความ, tables ตาราง และ plots กราฟต่างๆ

output แบบข้อความหรือText

ui <- fluidPage(
  textOutput("text"),
  verbatimTextOutput("code")
)
server <- function(input, output, session) {
  output$text <- renderText({ 
    "Hello friend!" 
  })
  output$code <- renderPrint({ 
    summary(1:10) 
  })
}
shinyApp(ui, server)

output แบบตาราง

ui <- fluidPage(
  tableOutput("static"),
  dataTableOutput("dynamic")
)
server <- function(input, output, session) {
  output$static <- renderTable(head(mtcars))
  output$dynamic <- renderDataTable(mtcars, options = list(pageLength = 5))
}
shinyApp(ui, server)

output แบบกราฟต่างๆ

ui <- fluidPage(
  plotOutput("plot", width = "400px")
)
server <- function(input, output, session) {
  output$plot <- renderPlot(plot(1:5), res = 96)
}
shinyApp(ui, server)

Exercise(s)

  1. outputs จากคำสั่ง textOutput() กับ verbatimTextOutput() ควรจะคู่กับ render อะไร
  1. renderPrint(summary(mtcars))
  2. renderText("Good morning!")
  3. renderPrint(t.test(1:5, 2:6))
  4. renderText(str(lm(mpg ~ wt, data = mtcars)))
ui <- fluidPage(
  verbatimTextOutput("mtcarsout1"),
  br(), hr(),
  textOutput("mtcarsout2"),
  br(), hr(),
  verbatimTextOutput("mtcarsout3"),
  br(), hr(),
  verbatimTextOutput("mtcarsout4")  
)
server <- function(input, output, session) {
  output$mtcarsout1 <- renderPrint(summary(mtcars))
  output$mtcarsout2 <- renderText("Good morning!")
  output$mtcarsout3 <- renderPrint(t.test(1:5, 2:6))
  output$mtcarsout4 <- renderPrint(str(lm(mpg ~ wt, data = mtcars)))
}
shinyApp(ui, server)
  1. ปรับเปลี่ยน options ใน renderDataTable() เพื่อแสดงข้อมูลอย่างเดียว โดยที่ให้ตัว controls อื่นๆอย่าง การเรียงลำดับ การค้นหา หรือการกรองข้อมูลไม่ทำงาน หาข้อมูลได้ที่ ?renderDataTable หรือ https://datatables.net/reference/option/ หรือ https://shiny.posit.co/r/gallery/widgets/datatables-options/
ui <- fluidPage(
      dataTableOutput("table")
    )
    server <- function(input, output, session) {
      output$table <- renderDataTable(mtcars, options = list(pageLength = 5))
    }
shinyApp(ui, server)
ui <- fluidPage(
  dataTableOutput("table")
)
server <- function(input, output, session) {
  output$table <- renderDataTable(mtcars, 
                                  options = list(pageLength = 5,
                                                 searching = FALSE,
                                                 paging = FALSE,
                                                 ordering = FALSE,
                                                 filtering = FALSE))
}
shinyApp(ui, server)

ภาพรวมของ Output functions

  • Output functions
    • htmlOutput()… ใช้เพื่อแสดงผลจาก HTML (!)
    • imageOutput()… แสดง image
    • plotOutput()… สร้าง plot
    • plotlyOutput … สร้าง plotly graph (!)
    • tableOutput()… สร้าง table
    • textOutput()… สร้าง text
    • uiOutput()… แสดงผลจาก HTML (!)
    • verbatimTextOutput()… สร้าง text
    • dataTableOutput()… สร้างตาราง data table (!)
    • leafletOutput() … สร้างแผนที่ leaflet
  • ใน Guerry app ก็ใช้ outputs ที่มีเครื่องหมาย (!).

HTML tag functions

  • HTML tag functions ทำหน้าที่แปลง input เป็น html
    • ทดลองพิมพ์ h2("A NEW HOPE", align = "center") ใน console
    • h2() function จะสร้างhtml <h2></h2>
  • ตัวHTML tags ทั่วไป (เช่น ⁠<div>⁠) สามารถเรียกใช้จากชื่อได้เลยเช่น div()
  • ตัวtagsที่ไม่ค่อยถูกใช้บ่อย ๆ อย่าง ⁠<article>⁠ อาจจะะต้องเรียกผ่าน list collection ที่ชื่อ tags เช่นtags$article()
    • ลองพิมพ์ tags$ ใน console
      • .noWS = ... argument สำหรับลบ whitespace
  • ดู full reference for HTML tags
  • ดู tutorial นี้อีกนะครับ
  • Exercise: รันตัวอย่างappด้านล่างนี้แล้วสังเกตผลลัพธ์ที่ได้จาการใช้ tagsต่างๆ
library(bs4Dash)
# UI ----
ui <- dashboardPage(title = "My Shiny App",

  ### Header ----
  header = dashboardHeader(),

  ### Sidebar ----
  sidebar = dashboardSidebar(),

  ### Body ----
  body = dashboardBody(
      h2("A NEW HOPE", align = "center"),
              h5("It is a period of civil war.", align = "center"),
      p("p creates a paragraph of text."),
      tags$p("A new p() command starts a new paragraph. Supply a style attribute to change the format of the entire paragraph.", style = "font-family: 'times'; font-si16pt"),
      strong("strong() makes bold text."),
      em("em() creates italicized (i.e, emphasized) text."),
      tags$hr(style="border-color:black;"),
      tags$br(),
      tags$line(),
      br(),
      code("code displays your text similar to computer code"),
      div("div creates segments of text with a similar style. This division of text is all blue because I passed the argument 'style = color:blue' to div", style = "color:blue"),
      br(),
      p("span does the same thing as div, but it works with",
        span("groups of words", style = "color:blue"),
        "that appear inside a paragraph."))
)


# Server ----

server <- function(input, output, session) {}

shinyApp(ui, server)

Guerry app: แนะนำ tab

  • ด้านล่างเป็นตัวอย่าง code จาก Guerry app ที่เกี่ยวกับการใช้ tab
    • อาจจะต้องลบบางส่วนออกเพื่อให้มันรันได้
      • เช่น includeCSS("www/styles.css")
    • รูปที่ไม่ขึ้นแสดงว่ามันหาไม่เจอ
    • หลายส่วนใน UI function ใช้ html tags เช่น h1() หรือ jumbotron()
Full R code including Shiny events
library(shiny)
library(htmltools)
library(bs4Dash)
library(fresh)
library(waiter)
library(shinyWidgets)
library(Guerry)
library(sf)
library(tidyr)
library(dplyr)
library(RColorBrewer)
library(viridis)
library(leaflet)
library(plotly)
library(jsonlite)
library(ggplot2)
library(GGally)
library(datawizard)
library(parameters)
library(performance)
library(ggdark)
library(modelsummary)


# 3 UI ----

ui <- dashboardPage(
  title = "The Guerry Dashboard",

  ## 3.1 Header ----
  header = dashboardHeader(
    
    span(style = "display: inline-block; width: 100%;"),
    a(
      class = "logo",
      href = "https://gesis.org/",
      img(src = "gesis-logo.png", style = "height: 1.8em;")
    ),
    title = tagList(
      img(src = "workshop-logo.png", width = 35, height = 35),
      span("The Guerry Dashboard", class = "brand-text")
    ),
    skin = "light",
    sidebarIcon = tags$i(class = "fa fa-bars", style = "color: black;")
  ),
  ## 3.2 Sidebar ----
  sidebar = dashboardSidebar(
    id = "sidebar",
    sidebarMenu(
      id = "sidebarMenu",
      menuItem(tabName = "tab_intro", text = "Introduction", icon = icon("home")),
      menuItem(tabName = "tab_tabulate", text = "Tabulate data", icon = icon("table")),
      menuItem(tabName = "tab_model", text = "Model data", icon = icon("chart-line")),
      menuItem(tabName = "tab_map", text = "Map data", icon = icon("map")),
      flat = TRUE
    ),
    minified = TRUE,
    collapsed = TRUE,
    fixed = FALSE,
    skin = "light"
  ),
  ## 3.3 Body ----
  body = dashboardBody(
    tabItems(
      ### 3.1.1 Tab: Introduction ----
      tabItem(
        tabName = "tab_intro",
        jumbotron(
            title = "The Guerry Dashboard",
            lead = "A Shiny app to explore the classic Guerry dataset.",
            status = "info",
            btnName = NULL
        ),
        fluidRow(
            column(width = 1),
          column(
            width = 6,
            box(
              title = "About",
              status = "primary",
              width = 12,
              blockQuote(HTML("André-Michel Guerry was a French lawyer and
                          amateur statistician. Together with Adolphe
                          Quetelet he may be regarded as the founder of
                          moral statistics which led to the development
                          of criminology, sociology and ultimately,
                          modern social science. <br>— Wikipedia: <a href='https://en.wikipedia.org/wiki/Andr%C3%A9-Michel_Guerry'>André-Michel Guerry</a>"),
                                 color = "primary"),
              p(HTML("Andre-Michel Guerry (1833) was the first to 
              systematically collect and analyze social data 
               on such things as crime, literacy and suicide 
               with the view to determining social laws and the 
               relations among these variables. The Guerry data 
               frame comprises a collection of 'moral variables' 
               (cf. <i><a href='https://en.wikipedia.org/wiki/Moral_statistics'>moral statistics</a></i>) 
               on the 86 departments of France around 1830. 
               A few additional variables have been added 
               from other sources. In total the data frame has 
               86 observations (the departments of France) on 23 variables <i>(Source: <code>?Guerry</code>)</i>. 
               In this app, we aim to explore Guerry’s data
                using spatial exploration and regression modelling.")),
              hr(),
              accordion(
                id = "accord",
                accordionItem(
                    title = "References",
                    status = "primary",
                    solidHeader = FALSE,
                    "The following sources are referenced in this app:",
                    tags$ul(
                        class = "list-style: none",
                        style = "margin-left: -30px;",
                        p("Angeville, A. (1836). Essai sur la Statistique de la Population française Paris: F. Doufour."),
                        p("Guerry, A.-M. (1833). Essai sur la statistique morale de la France Paris: Crochard. English translation: Hugh P. Whitt and Victor W. Reinking, Lewiston, N.Y. : Edwin Mellen Press, 2002."),
                        p("Parent-Duchatelet, A. (1836). De la prostitution dans la ville de Paris, 3rd ed, 1857, p. 32, 36"),
                        p("Palsky, G. (2008). Connections and exchanges in European thematic cartography. The case of 19th century choropleth maps. Belgeo 3-4, 413-426.")
                    )
                ),
                accordionItem(
                    title = "Details",
                    status = "primary",
                    solidHeader = FALSE,
                    p("This app was created as part of a Shiny workshop held in July 2023"),
                    p("Last update: June 2023"),
                    p("Further information about the data can be found",
                        a("here.", href = "https://www.datavis.ca/gallery/guerry/guerrydat.html"))
                )
              )
            )
          ),
          column(
            width = 4,
            box(
              title = "André Michel Guerry",
              status = "primary",
              width = 12,
              tags$img(src = "guerry.jpg", width = "100%"),
              p("Source: Palsky (2008)")
            )
          )
        )
      )
    ) # end tabItems
  ),

  ## 3.4 Footer (bottom)----
  footer = dashboardFooter(
    left = span(
        "This dashboard was created by Jonas Lieth and Paul Bauer. Find the source code",
        a("here.", href = "https://github.com/paulcbauer/shiny_workshop/tree/main/shinyapps/guerry"),
        "It is based on data from the",
        a("Guerry R package.", href = "https://cran.r-project.org/web/packages/Guerry/index.html")
    )
  ),
  ## 3.5 Controlbar (top)----
  controlbar = dashboardControlbar(
    div(class = "p-3", skinSelector()),
    skin = "light"
  )  
)


# 4 Server ----

server <- function(input, output, session) {}

shinyApp(ui, server)

สรุป

  • UI Layout: fluidPage() และ dashBoardPage() จะถูกใช้บ่อย
  • เราใส่รูป Image ด้วยคำสั่ง img(src = "...", , width = ..., height = ...)
  • *Input() functions: Used to generate input UI widgets
    • ค่าของ input ต่างจะถูกเก็บเป็นlistไว้ที่ input$... ซึ่งตามด้วยชื่อ name เช่น input$tab_tabulate_select
  • *Output() functions: Used to display output, dataTableOutput()
    • output จะถูกส่งมาจากส่วนของ server
  • ทั้ง input/output functions จะต้องมี IDs ที่เชื่อมกันกับ server
  • HTML tags สามารถใช้ผ่าน tags$name() function ได้ เช่น tags$br()
  • ที่ยังไม่พูดถึง:
    • Dynamic UI เราสามารถที่เปลี่ยน UI ได้เหมือนเป็น function ของ inputs เลย

Footnotes

  1. Bootstrap 4 shinydashboard using AdminLTE3: Website↩︎